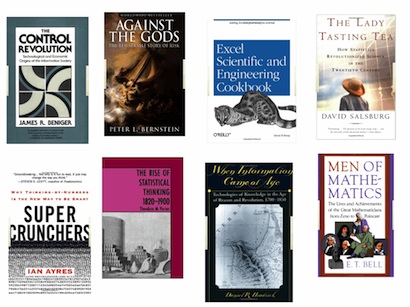
Here is a brief list of recommended books from my Quantitative Information Architecturetalk at the 2010 Information Architecture Summit that review many aspects of quantitative thinking (both good and bad) that relate to using mathematical methods to as a toolkit for information architecture issues.

Many of these books are non-fiction favorites. I’ve used them in courses I’ve taught, relied on them for research ideas and used them to convey how quantitative innovation is pursued.
- The Control Revolution: Technological and Economic Origins of the Information Society by James Beniger. Nearly encyclopedic in its coverage of the Industrial Revolution’s impact on creating the Information Age, where economic forces accelerated collecting, storing and capitalizing on data. Particularly interesting (truly!) are insights about the railroad industry and information technology (e.g the telegraph).
- Against the Gods: The Remarkable Story of Risk by Peter L. Bernstein. Just thinking about this book makes me want to read it again. It’s a swashbuckler of a story of the history of people using mathematics to tame the world. (Well, at least to me.) Bernstein’s style is surprisingly readable with narratives that keep you engaged.
- Excel Scientific and Engineering Cookbook by David M Bourg. A great (but aging) overview of doing statistics in spreadsheets, including regression and time series analysis. Not for beginners, but a good reference and reminder of the power of Excel for almost all manner of analysis. (The only downside to Excel is its limit for working with very large datasets.)
- The Lady Tasting Tea: How Statistics Revolutionized Science in the Twentieth Century by David Salsburg. Another fun read, a glance through the history of some of the more famous statisticians (my favorite being Andrey Nikolaevich Kolmogorov and a partial history of Soviet science).
- Super Crunchers: Why Thinking-By-Numbers is the New Way To Be Smart by Ian Ayres. The most readable (and current), with some basic introductory ideas presented in the context of how organizations such as Netflix, Southwest Airlines – and of course Google use numbers and industries including baseball and wine-making are impacted by quantitative work.
- The Rise of Statistical Thinking, 1820-1900 by Theodore M. Porter. This book is mostly thematic, covering the rise of statistics and their influence in the social sciences. A bit dry (and poorly typeset) but a foundational study. (Feel free to rely on the Index to jump around to people or topics you might be more interested in.)
- When Information Came of Age: Technologies of Knowledge in the Age of Reason and Revolution, 1700-1850 by Daniel R. Headrick. This book was a quick read, suggesting a number of common themes such as the rise of the Age of Reason and the parallel development of scientific instrumentation. As empirical sciences progressed, a resulting increase in collected data brought forth the origins, expansion and professionalization of many kinds of information systems including graphs, maps, encyclopedias, the post office and insights of key scientists of the age (e.g. Carl Linnaeus). Not as grand in scope as other recommended books, but focuses more clearly on types of information that are often the focus of IA efforts.
- Men of Mathematics by E.T. Bell. A somewhat stilted (written in the 1930’s) biographical walk-through of many storied mathematicians (i.e the people’s names you hated to hear in 10th grade Geometry), that reveals the history of quantitative analysis and the intellectual vigor (did I just say that?) of those like Gauss or Lagrange. Even if the math itself is not your normal interest, this book is an index of obsession, diligence and ingenuity.
- The History of Statistics: The Measurement of Uncertainty before 1900 by Stephen M. Stigler (not shown). I have not finished this book, and there is a lot in it that I do not have much interest in, and have put it down several times (it is a bit dry). However, the integration of how different statistical measures were built progressively is interesting. Also, one of the better sets of discussion about Karl Pearson.

-
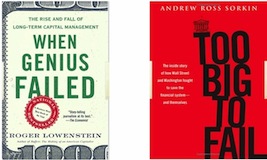
Two books illustrate the downfall of quantitative hubris (among other things) and both are fun to read.
- When Genius Failed: The Rise and Fall of Long-Term Capital Management by Roger Lowenstein. This book narrates the catastrophic failure of Long-Term Capital Management, the fabled sure-bet genius-powered hedge fund that boasted two Nobel laureates among its partners and how they nearly crashed the entire world financial system with this overconfidence in 1998.
- Too Big to Fail: The Inside Story of How Wall Street and Washington Fought to Save the Financial System—and Themselves by Andrew Ross Sorkin. A detailed (600 page plus) report of the nearly minute to minute recent financial crisis and an indictment of over-reliance on trusting abstract mathematics without (any?) explanation or validation. Worth remembering when confronted with abundant or seemingly infallible data-driven results that we should not be intimidated and remember to ask Why? and How?.