Tag Archives: analytics

Methodologies for Understanding Web Use with Logging in Context

Methodologies for Understanding Web Use with Logging in Context

[PDF]

Don Turnbull

Abstract

This paper describes possible approaches of data collection and analysis methods that can be used to understand Web use via logging. First, a method devised by Choo, Detlor, & Turnbull (1998, 1999 & 2000) that can be used to offer a comprehensive, empirical foundation for understanding Web logs in context by gaining insight into Web use from three diverse sources: an initial survey questionnaire, usage logs gathered with a custom-developed Web tracking application and follow-up interviews with study participants. Second, a method of validating different types of Web use logs is proposed that involves client browser trace logs, intranet server and firewall or proxy logs. Third and finally, a system is proposed to collected and analyze Web use via proxy logs that classify Web pages by content.

Excerpt

It is often thought that in some configurations, client browsing application local caching settings may influence server-based logging accuracy. If it is not efficient to modify each study participant’s browser settings (or that temporarily modifying participants browser settings for the study period affects true Web use) a method of factoring in what may be lost due to local cache may be applied. … By tuning intranet server logging settings and collecting and analyzing these logs, some initial measurement of the differences that client browser caching makes in accurate firewall logs can be made. Comparisons to access on the organizations intranet Web server logs such as total page requests per page, time to load, use of REST or AJAX interaction and consistent user identification can be made to the more raw logging from the firewall logs collected

Update

What’s novel about this paper is the introduction of using different datasets to validate or triangulate the veracity and accuracy of log data. Often, logs are collected and processed without context to explain subtle interaction patterns, especially in relation to user behavior. By coordinating a set of quantitative resources, often with accompanying qualitative data, a much richer view of Web use is achieved. This is worth remembering when relying on Web Analytics tools to form a picture of a Web site’s use or set of Web user interactions: you need to go beyond the basic statistical measures (often far beyond what typical log analysis software provides, certainly by their default reports) and design new analysis techniques to gain understanding.

Keywords

browser history, firewall logs, intranet server logs, web use, survey, questionnaire, client application, webtracker, interview, methodology, logs, server logs, proxy, firewall, analytics, content classification, client trace, transaction log analysis, www

Cite As

Turnbull, D. (2006). Methodologies for Understanding Web Use with Logging in Context. Paper presented at the The 15th International World Wide Web Conference, Edinburgh, Scotland.

References in this publication

  • Auster, E., & Choo, C. W. (1993). Environmental scanning by CEOs in two Canadian industries. Journal of the American Society for Information Science, 44(4), 194-203.
  • Catledge, L. D., & Pitkow, J. E. (1995). Characterizing Browsing Strategies in the World-Wide Web. Computer Networks and ISDN Systems, 27, 1065-1073.
  • Choo, C.W., Detlor, B. & Turnbull, D. (1998). A Behavioral Model of Information Seeking on the Web — Preliminary Results of a Study of How Managers and IT Specialists Use the Web. Proceedings of the 61st Annual Meeting of the American Society of Information Science, 290-302.
  • Choo, C.W., Detlor, B. & Turnbull, D. (1999). Information Seeking on the Web – An Integrated Model of Browsing and Searching. Proceedings of the 62nd Annual Meeting of the American Society of Information Science, Washington, D.C.
  • Choo, C.W., Detlor, B. & Turnbull, D. (2000). Web Work: Information Seeking and Knowledge Work on the World Wide Web. Dordrecht, The Netherlands, Kluwer Academic Publishers.
  • Cuhna, C.R., Bestavros, A. & Crovella, M.E. (1995). Characteristics of WWW Client-Based Traces. Technical Report #1995-010. Boston University, Boston MA.
  • Flanagan, J. C. (1954). The critical incident technique. Psychological Bulletin 51(4), 327-358.
  • Jansen, B. J., Spink, A. & Saracevic, T. (2000) Real life, real users, and real needs: a study and analysis of user queries on the Web. Information Processing & Management, Volume 36, Issue 2, pp 207-227.
  • Jansen, B. J. (2005) Evaluating Success in Search Systems. Proceedings of the 66th Annual Meeting of the American Society for Information Science & Technology. Charlotte, North Carolina. 28 October – 2 November.
  • Kehoe, C., Pitkow, J. & Rogers, J. (1998). GVU’s Ninth WWW User Survey Report. http://www.gvu.gatech.edu/user_surveys/survey-1998-04.
  • Pitkow, J. and Recker, M. (1994). Results from the first World-Wide Web survey. Special issue of Journal of Computer Networks and ISDN systems, 27, 2.
  • Pitkow, J. (1997, April 7-11). In Search of Reliable Usage Data on the WWW. Sixth International World Wide Web Conference Proceedings, Santa Clara, CA.
  • Rousskov, A. & Soloviev, V. (1999) A performance study of the Squid proxy on HTTP/1.0. World Wide Web., 2, 1-2, pp 47 – 67.

Publications that cite this publication

Related Articles

Recommended Reading

Jansen, B.J. and Ramadoss, R. and Zhang, M. and Zang, N. (2006). Wrapper: An application for evaluating exploratory searching outside of the lab. EESS, p 14.

Quantitative Information Architecture recommended reading

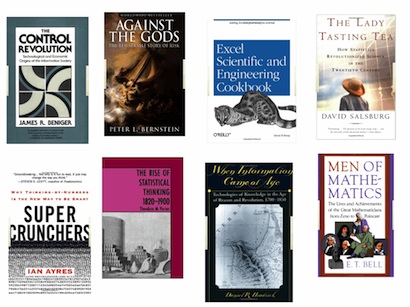
Here is a brief list of recommended books from my Quantitative Information Architecturetalk at the 2010 Information Architecture Summit that review many aspects of quantitative thinking (both good and bad) that relate to using mathematical methods to as a toolkit for information architecture issues.


Quantitative Information Architecture Books

Many of these books are non-fiction favorites. I’ve used them in courses I’ve taught, relied on them for research ideas and used them to convey how quantitative innovation is pursued.

  1. The Control Revolution: Technological and Economic Origins of the Information Society by James Beniger. Nearly encyclopedic in its coverage of the Industrial Revolution’s impact on creating the Information Age, where economic forces accelerated collecting, storing and capitalizing on data. Particularly interesting (truly!) are insights about the railroad industry and information technology (e.g the telegraph).
  2. Against the Gods: The Remarkable Story of Risk by Peter L. Bernstein. Just thinking about this book makes me want to read it again. It’s a swashbuckler of a story of the history of people using mathematics to tame the world. (Well, at least to me.) Bernstein’s style is surprisingly readable with narratives that keep you engaged.
  3. Excel Scientific and Engineering Cookbook by David M Bourg. A great (but aging) overview of doing statistics in spreadsheets, including regression and time series analysis. Not for beginners, but a good reference and reminder of the power of Excel for almost all manner of analysis. (The only downside to Excel is its limit for working with very large datasets.)
  4. The Lady Tasting Tea: How Statistics Revolutionized Science in the Twentieth Century by David Salsburg. Another fun read, a glance through the history of some of the more famous statisticians (my favorite being Andrey Nikolaevich Kolmogorov and a partial history of Soviet science).
  5. Super Crunchers: Why Thinking-By-Numbers is the New Way To Be Smart by Ian Ayres. The most readable (and current), with some basic introductory ideas presented in the context of how organizations such as Netflix, Southwest Airlines – and of course Google use numbers and industries including baseball and wine-making are impacted by quantitative work.
  6. The Rise of Statistical Thinking, 1820-1900 by Theodore M. Porter. This book is mostly thematic, covering the rise of statistics and their influence in the social sciences. A bit dry (and poorly typeset) but a foundational study. (Feel free to rely on the Index to jump around to people or topics you might be more interested in.)
  7. When Information Came of Age: Technologies of Knowledge in the Age of Reason and Revolution, 1700-1850 by Daniel R. Headrick. This book was a quick read, suggesting a number of common themes such as the rise of the Age of Reason and the parallel development of scientific instrumentation. As empirical sciences progressed, a resulting increase in collected data brought forth the origins, expansion and professionalization of many kinds of information systems including graphs, maps, encyclopedias, the post office and insights of key scientists of the age (e.g. Carl Linnaeus). Not as grand in scope as other recommended books, but focuses more clearly on types of information that are often the focus of IA efforts.
  8. Men of Mathematics by E.T. Bell. A somewhat stilted (written in the 1930’s) biographical walk-through of many storied mathematicians (i.e the people’s names you hated to hear in 10th grade Geometry), that reveals the history of quantitative analysis and the intellectual vigor (did I just say that?) of those like Gauss or Lagrange. Even if the math itself is not your normal interest, this book is an index of obsession, diligence and ingenuity.
  9. The History of Statistics: The Measurement of Uncertainty before 1900 by Stephen M. Stigler (not shown). I have not finished this book, and there is a lot in it that I do not have much interest in, and have put it down several times (it is a bit dry). However, the integration of how different statistical measures were built progressively is interesting. Also, one of the better sets of discussion about Karl Pearson.


Quantitative Information Architecture Books

    Two books illustrate the downfall of quantitative hubris (among other things) and both are fun to read.

  1. When Genius Failed: The Rise and Fall of Long-Term Capital Management by Roger Lowenstein. This book narrates the catastrophic failure of Long-Term Capital Management, the fabled sure-bet genius-powered hedge fund that boasted two Nobel laureates among its partners and how they nearly crashed the entire world financial system with this overconfidence in 1998.
  2. Too Big to Fail: The Inside Story of How Wall Street and Washington Fought to Save the Financial System—and Themselves by Andrew Ross Sorkin. A detailed (600 page plus) report of the nearly minute to minute recent financial crisis and an indictment of over-reliance on trusting abstract mathematics without (any?) explanation or validation. Worth remembering when confronted with abundant or seemingly infallible data-driven results that we should not be intimidated and remember to ask Why? and How?.

Quantitative Information Architecture at the 2010 Information Architecture Summit

I am presenting on two different topics at the 2010 Information Architecture Summit in Phoenix this week.

The first talk is a set of ideas related to the work I’ve been doing recently, building data structures, crafting algorithms and designing user experiences that are powered by quantitative data.

Quantitative Information Architecture – Don Turnbull, Ph.D.

10:30 – 11:15AM on Saturday, April 10 in Ellis

Why quantitative information architecture? Why now?

You don’t have to be RainMan or Stephen Hawking to use numbers to get things
done. Quantitative methods are applicable for IA thinking be it for hypothesis
generation, instrumentation, data collection and analysis of information at
scales never before possible with insights that are comparable over time,
generalizable and extensible.

Quantitative skills can allow IAs to interpret and analyze others’ designs and
research more readily, as well as combine methods and models for meta-analysis
to help IAs move from description to prediction in designing and developing
future interfaces and architectures.

This presentation will review why you should use quantitative methods and
discuss both foundational and emerging ideas that are applicable for content
analysis, behavioral modeling, social media usage, informetrics and other
IA-related issues.

The twitter hashtag for this talk is #quantia. Feel free to send me questions directly via twitter/donturn too.

Quantiative Information Architecture slide deck from the 2010 IA Summit

Advertising & Awareness with Sponsored Search: an exploratory study examining the effectiveness of Google AdWords at the local and global level

I will be giving a research talk (added recently, thus not on the conference Web page yet) titled: Advertising & Awareness with Sponsored Search:  an exploratory study examining the effectiveness of Google AdWords at the local and global level on October 28 at the American Society of Information Science & Technology (ASIS&T) 2008 Annual Meeting (AM08) in Columbus, Ohio.

This is the abstract for the talk:

This talk reviews an exploratory study of sponsored search advertising for a major US university’s academic department. The ad campaign used Google’s AdWord service with the goal of increasing awareness – not eCommerce – as part of the search process.  A behavioral model of information seeking is suggested that could be applied for selecting appropriate types of online advertising for awareness and other advertising goals. Insights into the study methodology will also be discussed including the use of increased integration with server logs, targeted site query terms and alternative awareness strategies. 

The talk is part of the panel AM08 2008 – The Google Online Marketing Challenge: A Multi-disciplinary Global Teaching and Learning Initiative Using Sponsored Search with Bernard Jansen, Mark A. Rosso, Dan Russell, Brian Detlor and Don Turnbull.

This is a summary of the panel:

Sponsored search is an innovative information searching paradigm. This panel will discuss a vehicle to explore this unique medium as an educational opportunity for students and professors. From February to May 2008, Google will run its first ever student competition in sponsored search, The Google Online Marketing Challenge http://www.google.com/onlinechallenge/. Similar to other Google initiatives, the extent seems huge. Based on pre-registrations, more than two hundred professors and nearly nine thousand students from approximately 50 countries will compete. This may be the largest, worldwide educational course ever done. It is certainly on a large scale.

The Google Online Marketing Challenge is a real-life, problem-based, and multidisciplinary educational endeavor of the kind that many educators say is needed to relate teaching to outside the classroom. However, such endeavors are not without risks. The session should appeal to professors that competed in the 2008 Challenge, any professors considering the 2009 Challenge, as well as other educators who might consider the inclusion of Google AdWords as a pedagogical tool in their curricula. The panel will also be of great interest to those information professionals and educators as a possible model for use in other domains besides sponsored search.

Behavioral Finance 101

Great, short article on Slate by Henry Blodget about the mistakes we make when investing – which really applies to many other areas of life: Born Suckers – The greatest Wall Street danger of all: you. By Henry Blodget

Most interestingly, the Prospect Theory concept applies to many other aspects of behavior, including foraging theory and when mixed with the Confirmatory Bias, can lead to numerous costly mistakes.

Much of this work reflects recent Nobel laureate Daniel Kahneman’s work (along with Amos Tversky, but Nobels aren’t awarded posthumously) .

Other notable, perhaps more readable interpretations are in Thomas Gilovich’s excellent books Why Smart People Make Big Money Mistakes And How To Correct Them: Lessons From The New Science Of Behavioral Economics and How We Know What Isn’t So.